%关于连续函数求傅里叶变换
%用有限长序列近似 原函数(利用e^-5 约为 0)
%从而确定出序列间隔T的范围,接下来要确定T的步进量
%要求:步进T<<采样间隔
%先求出傅里叶变换换后 幅值在什么(设为f)频率下趋向0
%步进T取一个值<<1/f\
%analog signal
dt = 0.00005; %时间步进量
t = -0.005:dt:0.005; %时间范围
xa = exp(-1000*abs(t)); %求函数值
%contunites_time fourier transform
Wmax = 2*pi* 2000; %观察的最高频率
K = 500; %500份频率值
k = 0: 1: K;
W = k*Wmax/K;
Xa = xa * exp(-1i * t'*W)*dt;
Xa = real(Xa);
W = [-fliplr(W),W(2:501)]; %Flip matrix left to right 倒置 左右逐个交换
Xa = [fliplr(Xa),Xa(2:501)]; %xa over -Xa to Xa 合并矩阵
subplot(2,1,1);
plot(t*1000,xa);grid
title('analog signal');
xlabel('t (ms)');
ylabel('xa(t)');
subplot(2,1,2);
plot(W/(2*pi*1000),Xa*1000);grid
title('continues_time fourier transform');
xlabel('f (Khz)');
ylabel('Xa(jw) * 1000');

%analog signal
dt = 0.00005;
t = -0.005: dt: 0.005;
xa = exp(-1000*abs(t));
%discrete_time signal
ts = 0.0002;
n = -25:1:25;
x = exp(-1000*abs(n*ts));
%discrete-fourier transform
K = 500;
k = 0:1:K;
w = 2*pi*k/K;
X = x*exp(-1i *n'*w);
X= real(X);
w = [-fliplr(w),w(2:K+1)];
X = [fliplr(X),X(2:K+1)]; %要对应-w所求的值
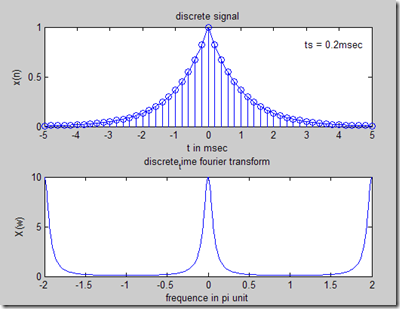
subplot(2,1,1);
%hold on retains the current plot and certain axes properties so that
%subsequent graphing commands add to the existing graph. If no
%current axes exist before you call hold on, MATLAB creates new
%axes and retains the default properties. However, some axes
%properties change to accommodate additional graphics objects.
%For example, the axes' limits increase when the data requires them
%to do so. hold on sets the NextPlot property of the current figure and axes to add.
plot(t*1000,xa);
title('discrete signal');
xlabel('t in msec');
ylabel('x(n)');
hold on
%stem(X,Y) stem Plot discrete sequence data
stem(n*ts*1000,x);
%gtext Mouse placement of text in 2-D view
%gtext displays a text string in the current figure window after you select
%a location with the mouse.
%gtext('string')
%hold Retain current graph in figure
%hold off resets axes properties to their defaults before drawing new
%plots. hold off is the default. hold off sets the NextPlot property of the current axes to replace.
gtext('ts = 0.2msec'); hold off
subplot(2,1,2);
plot(w/pi, X);
title('discrete_time fourier transform');
xlabel('frequence in pi unit');
ylabel('X(w)'); |